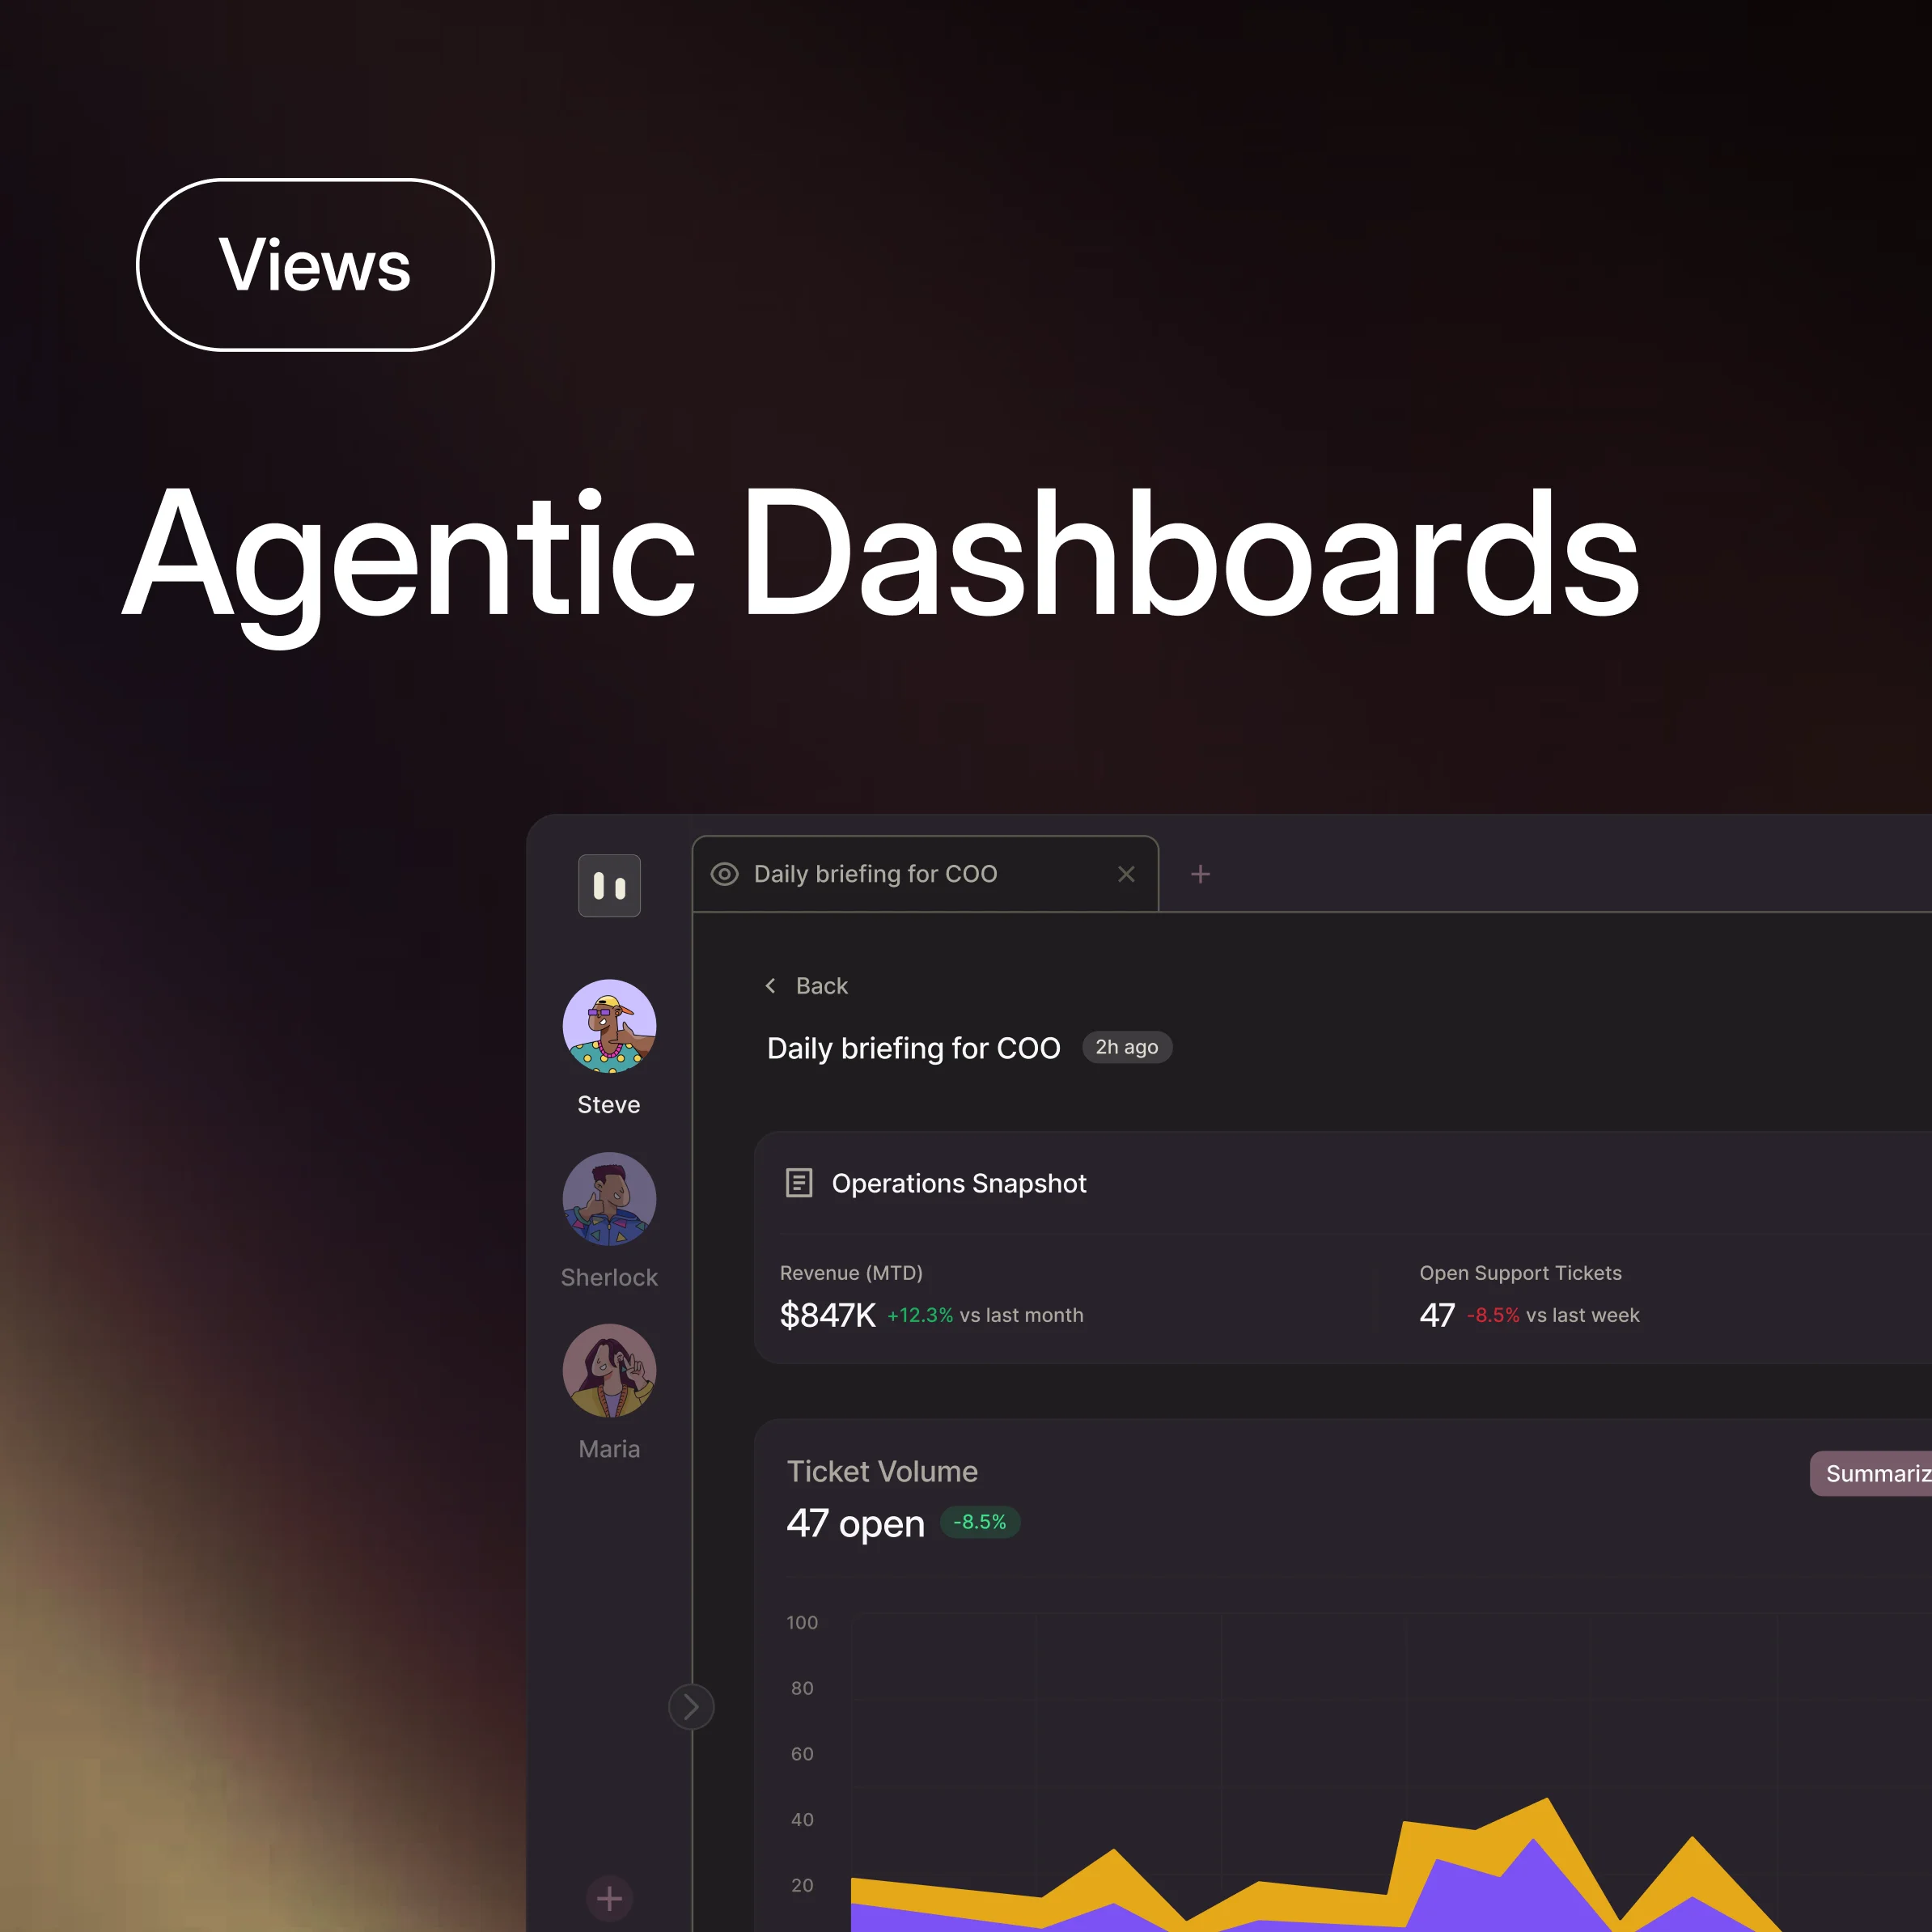
Agentic Dashboards
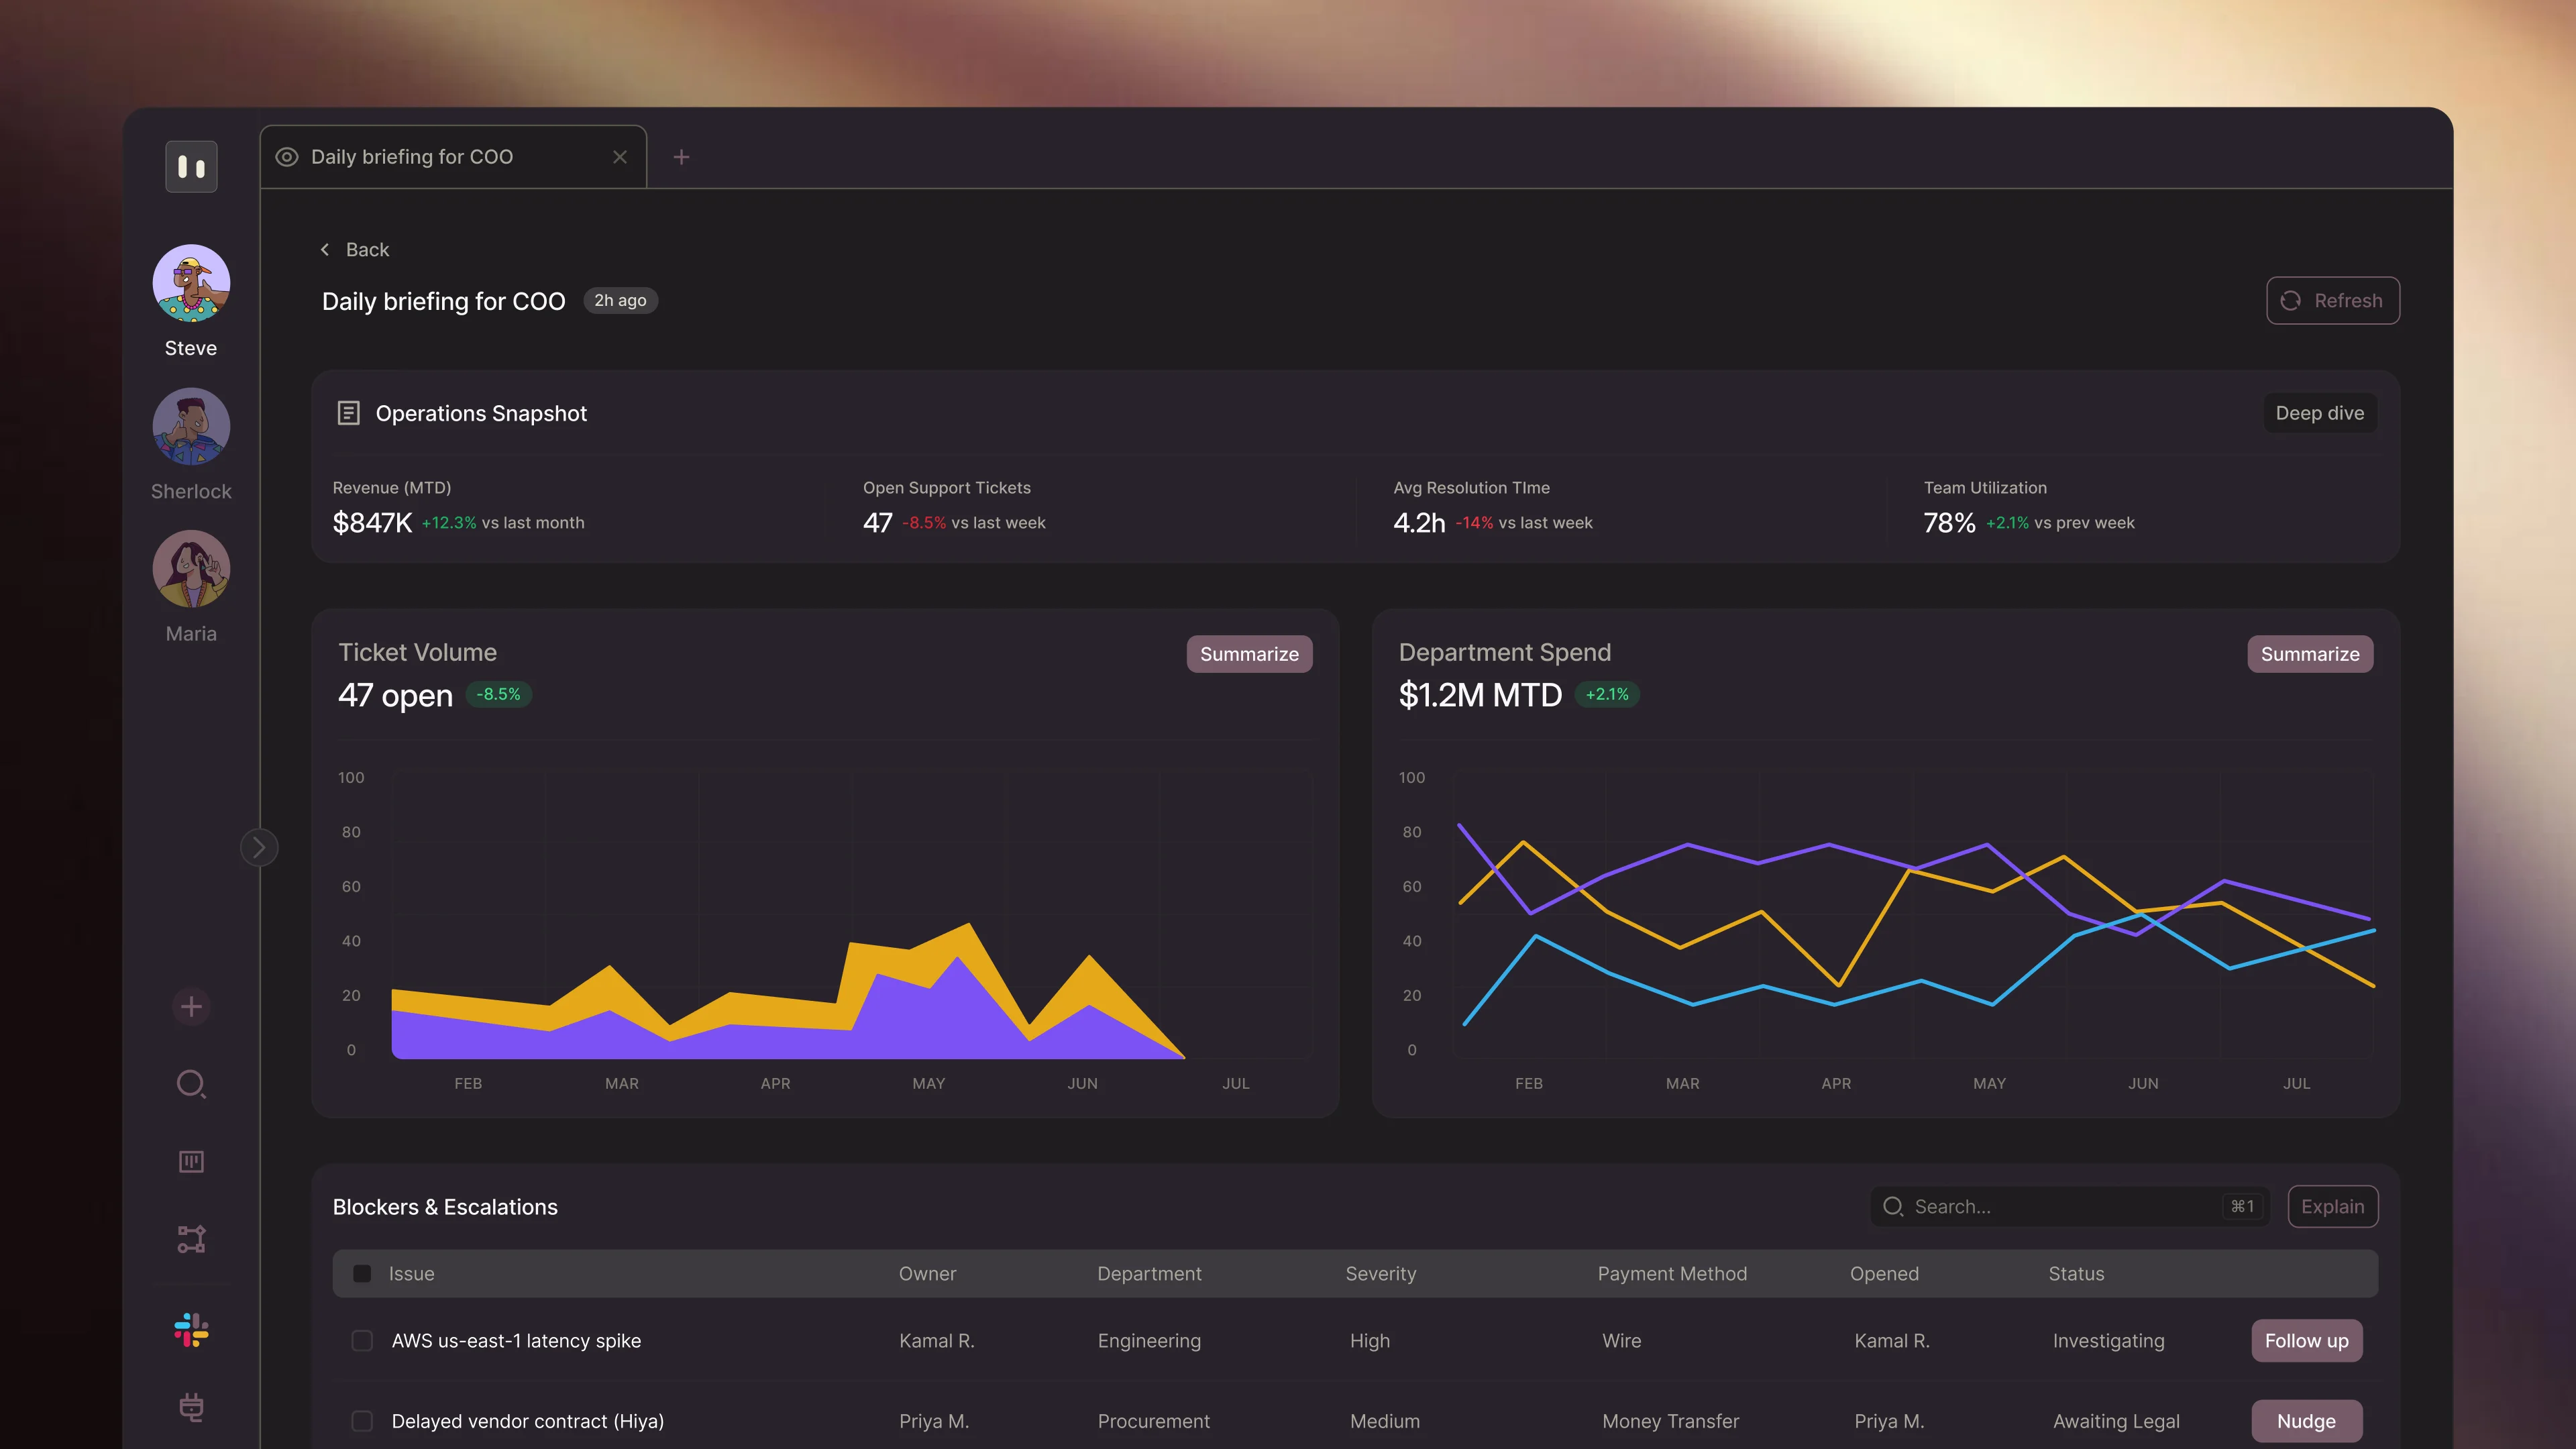
See everything, miss nothing. Build live dashboards that show pipeline health, revenue metrics, colleague activity, and operational signals — all updated by your AI colleagues in real time.
Dashboards for the metrics that matter
Your colleagues generate dashboards from the data they already process. Describe what you want to track — pipeline, revenue, team performance — and they build it in seconds. No manual setup, no stale numbers.
- Seconds to build
- Always up to date
- Custom metrics
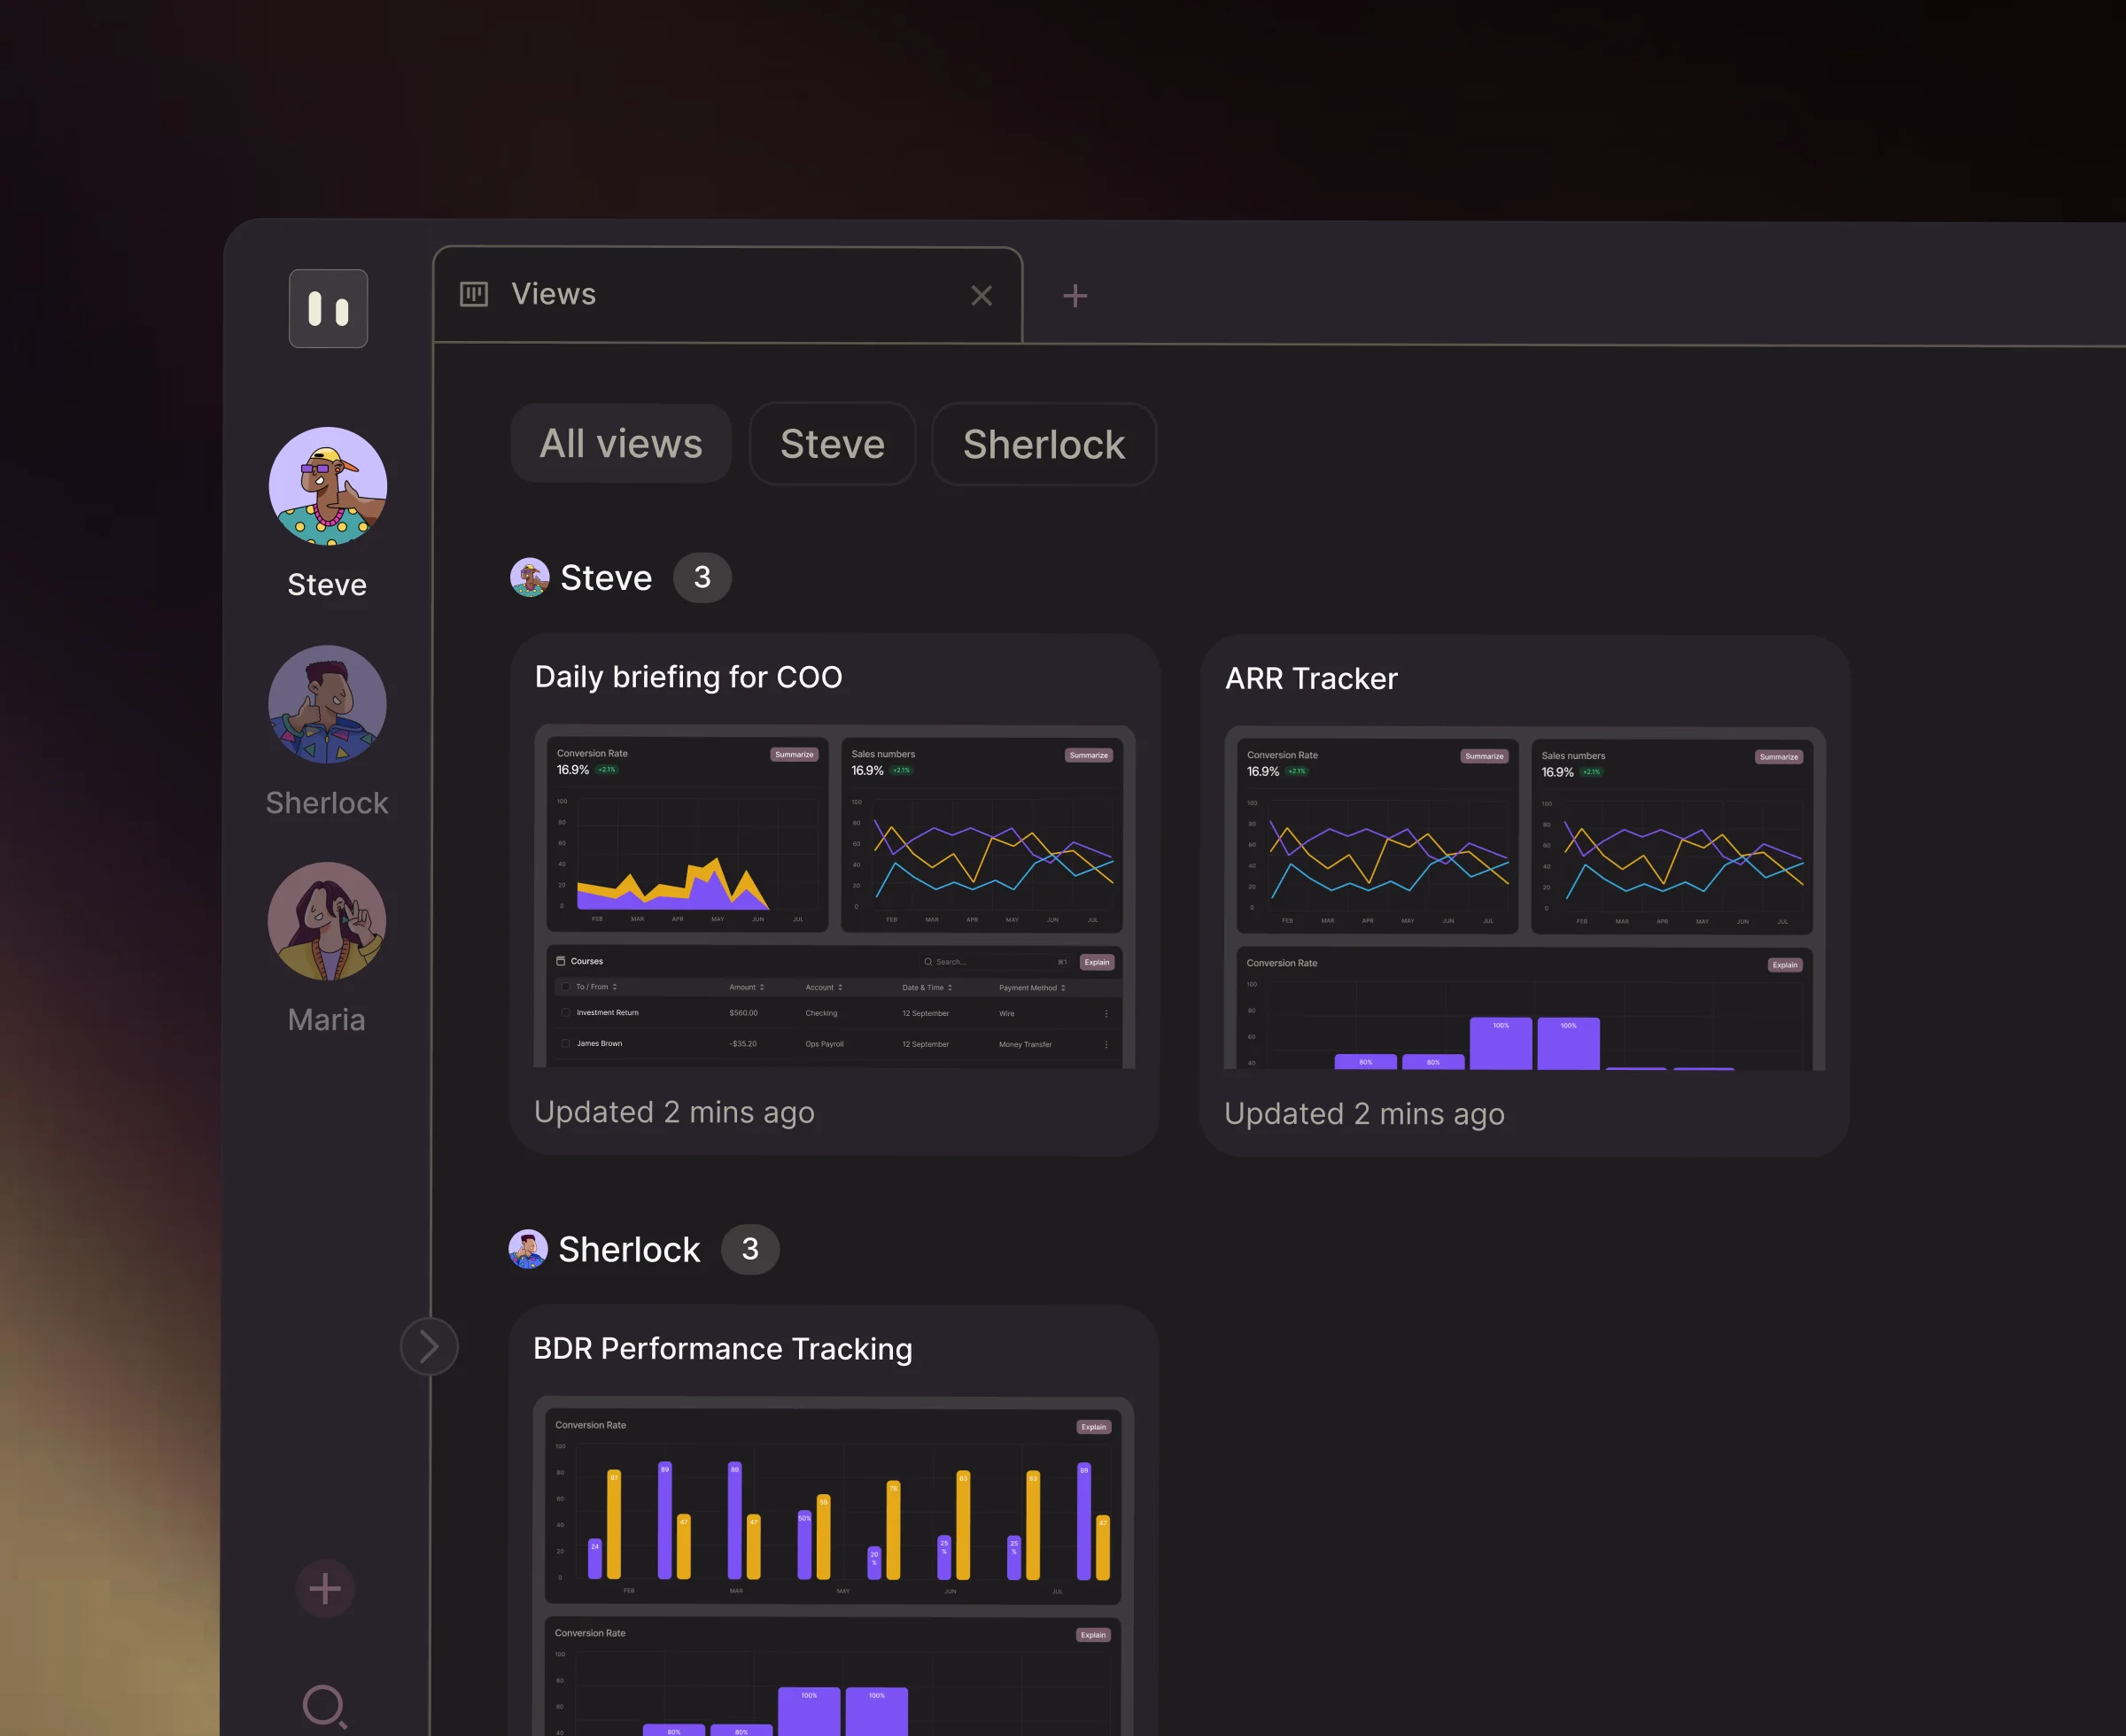
From data to decisions
Pull data from CRM, billing, spreadsheets, and support tools into a single view. Set alert thresholds so your colleagues can flag anomalies and take action automatically.
- Cross-source aggregation
- Alert thresholds
- Shareable
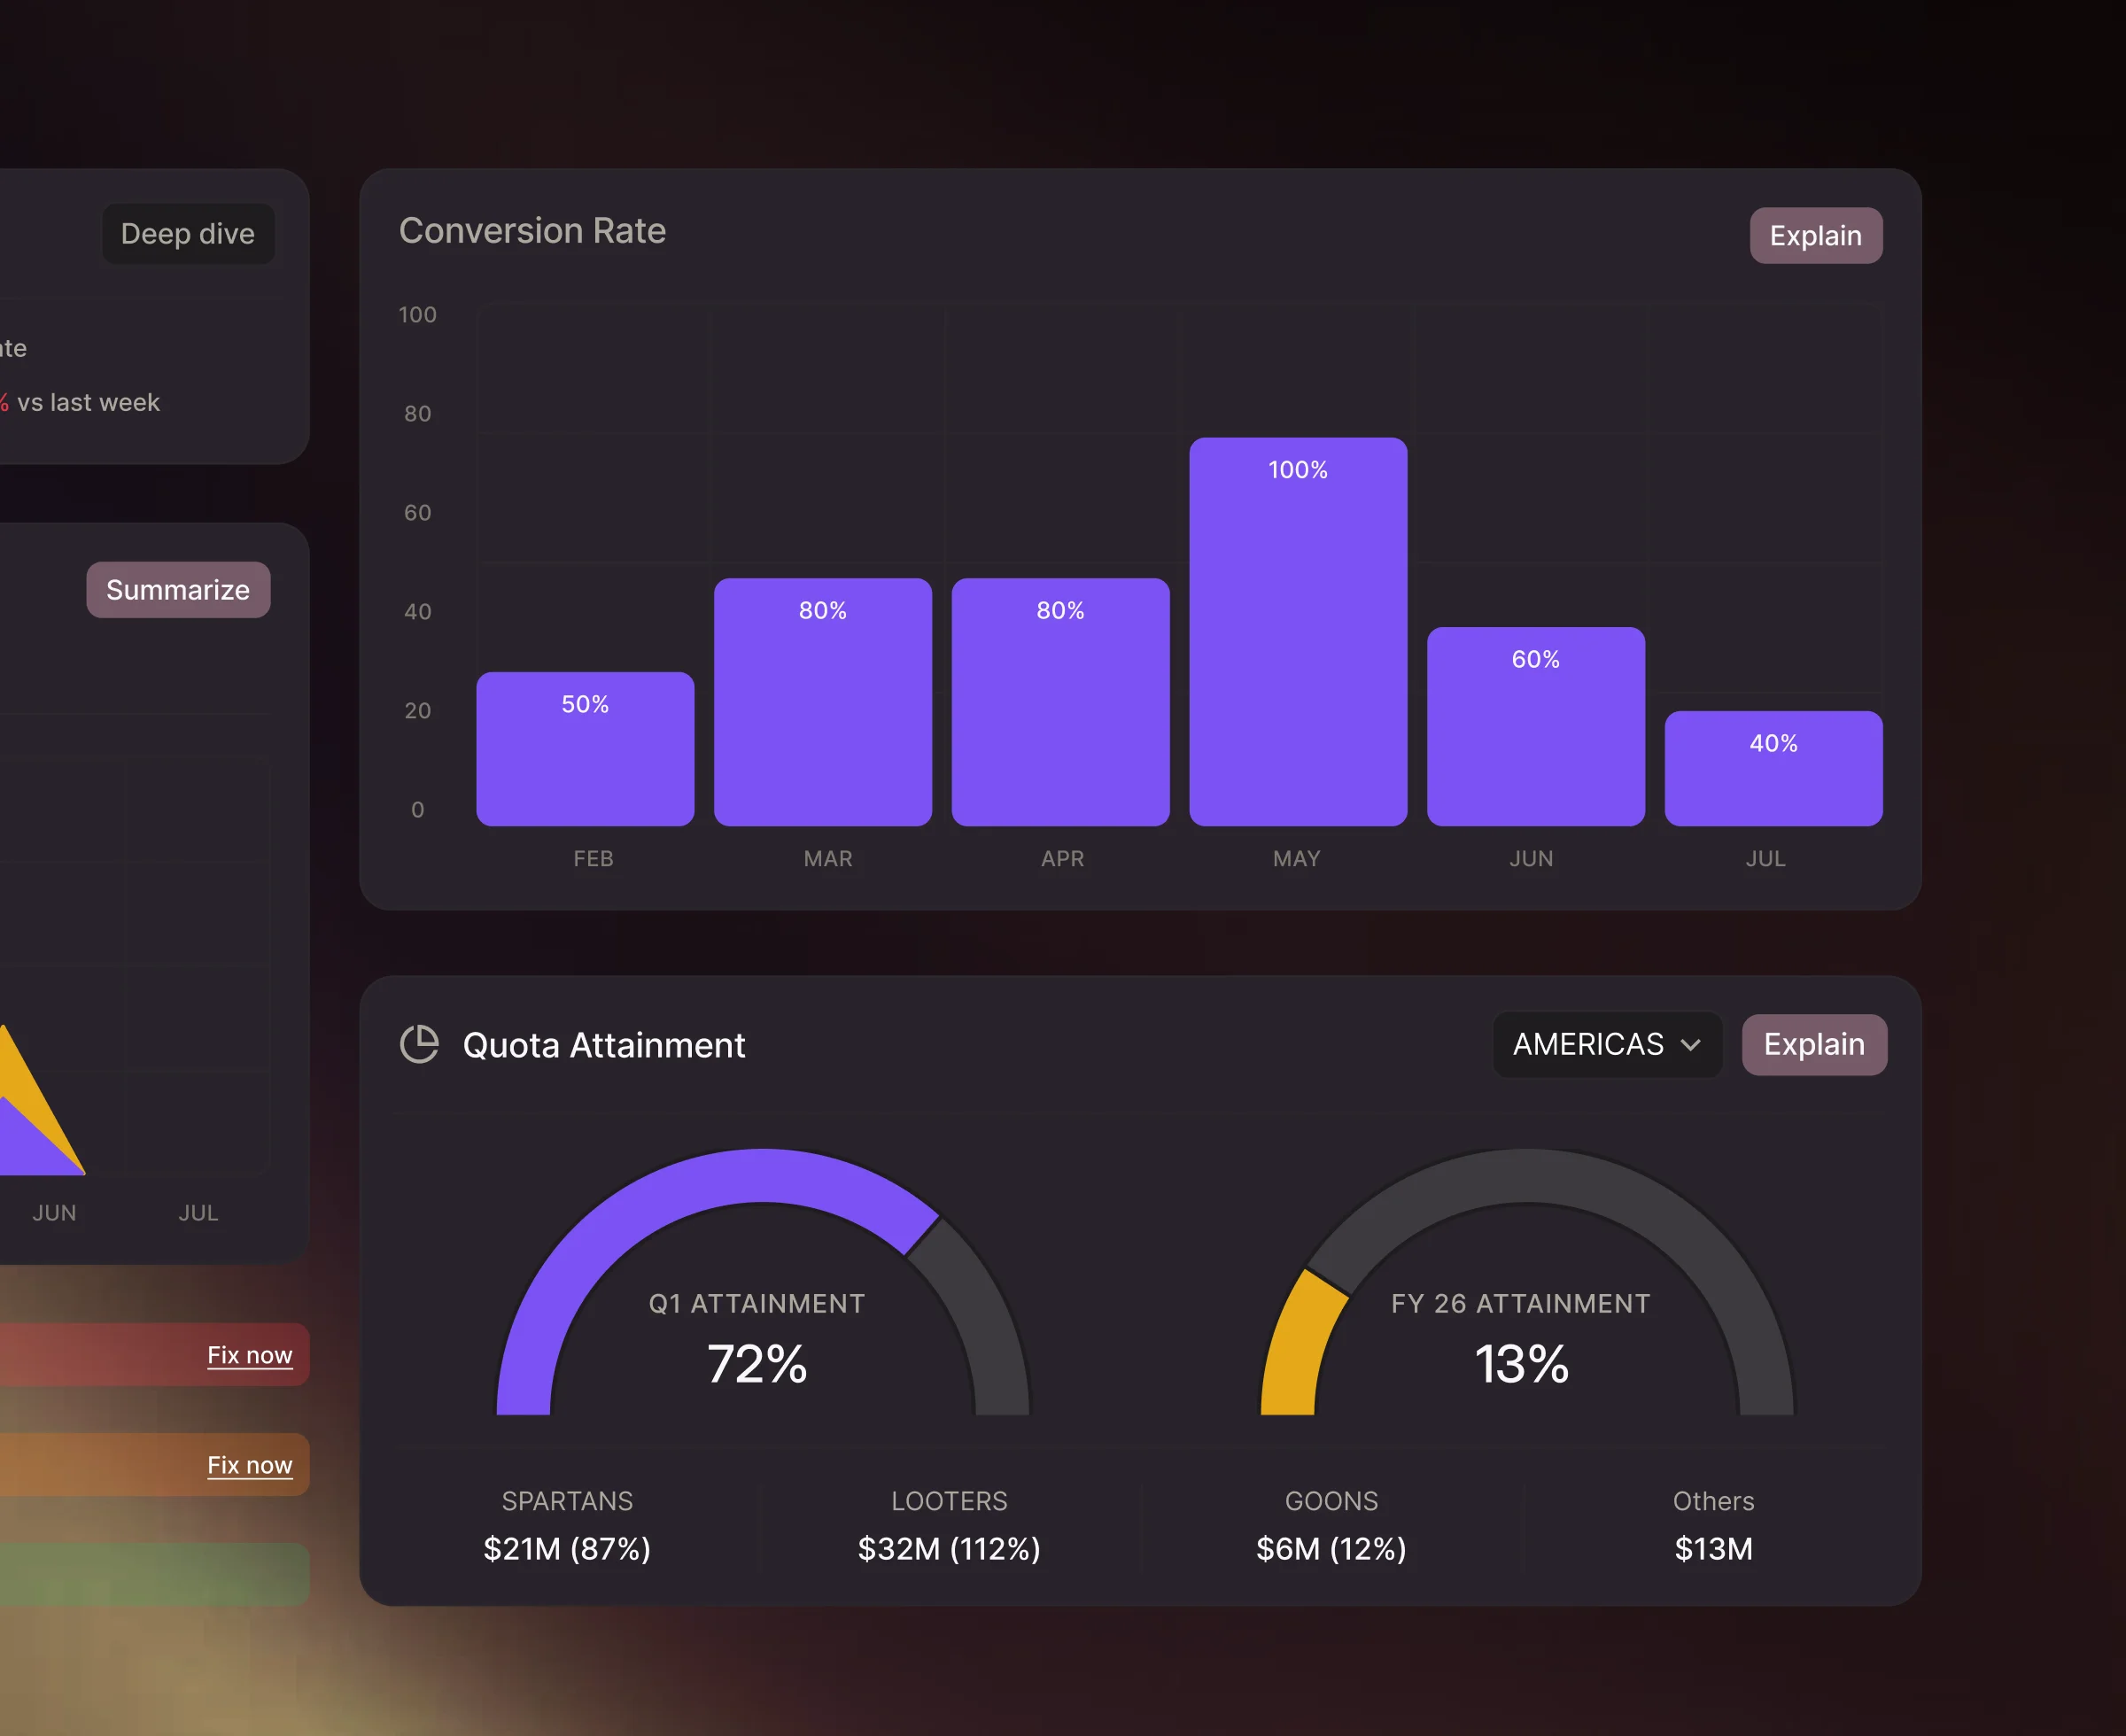
Proven results with Views
Real-time data updates
dashboards refresh automatically as colleagues process new information
< 30 sec to build
average time for a colleague to generate a custom dashboard
50+ metric types
pipeline, revenue, activity, and operational metrics — all auto-populated

“We've got 20-30 projects in flight at any time, each with its own timeline and milestones. What used to take my analyst an entire morning to pull together, Views shows live the second I open it.”
Project Lead, Escalent